Tracking customer retention helps you grow your business by keeping customers happy and loyal. But without the right metrics and data, you won’t know how well you’re doing or see where improvements should be made to drive more success.
This guide shows you how to calculate seven popular retention metrics and key performance indicators (KPIs), plus why these metrics are important.
With this valuable information, you can benchmark your performance and use data to make optimizations that increase retention—and improve ROI and new customer conversions in the process.
7 customer retention metrics and KPIs to track for business growth
These seven customer retention metrics help you measure how well your company currently retains and satisfies customers. Pick two or three that align with your business goals and include a mix of sales data (e.g. how much customers spend) and feedback (e.g. customer comments) to make sure you’re both tracking retention and trying to improve it.
1. Customer retention rate (CRR)
Customer retention rate (CRR) is the percentage of customers who stick with a company over time. CRR is often used by subscription and service businesses like SaaS, banking, and telecom companies—the ecommerce equivalent is repeat purchase rate (see below!).
How to calculate customer retention rate: choose a timeframe (usually a month or year), subtract the number of new customers gained during that period from the total number at the end, divide the result by the number of customers at the start, and multiply by 100:
Customer retention rate = ((End number of customers – New customers gained) / Starting number of customers) x 100
For example, if you had 1,000 customers on Jan. 1 and 1,200 customers on Dec. 31, and gained 400 new customers throughout the year, your annual customer retention rate would be:
((1200 – 400) /1000) x 100 = 80%
What is a good customer retention rate?
![[Visual] Kit’s customer retention rate](https://images.ctfassets.net/gwbpo1m641r7/2VxuJSK80suZcylAavoV5Q/9e836dd473e9f6c87fe32e6121a490b6/image2__16_.png?w=3840&q=100&fit=fill&fm=avif)
Kit’s customer retention rate by cohort displayed in customer retention tool, Baremetrics
For SaaS companies, a monthly retention rate of 95% (representing 5% churn) is generally considered good. For reference, creator marketing platform Kit has a monthly retention rate of around 96%, and social media toolkit Buffer has a retention rate of around 95%.
A low retention rate could mean your customers have problems when purchasing from you or using your product. To find out what the specific issues are—and avoid losing revenue and reputation to churn—review qualitative customer insights from session replays, surveys, and voice of customer tools.
💡Pro tip: increase customer retention rate through personalization
Zoopla, a residential property app, used Contentsquare’s Journey Analysis to understand where personalization would have the biggest impact within their user portal.
![[Customer Story] [Clarins] Journey Analysis](https://images.ctfassets.net/gwbpo1m641r7/4nozxbnvlcRqDnxYjbPNnm/707c4b2a2c0c36077eb336538bb1098c/Complex.svg?w=1920&q=100&fit=fill)
An example of Contentsquare’s Journey Analysis tool
Zoopla’s head of analytics, Veronica, notes that personalization improves user experiences, which impacts retention:
If you have a good retention rate, then you don’t have to work as hard to acquire customers over and over again. Positive brand interactions create a flywheel—when you give your customers a great experience, they’ll come back for more and you’ll get to understand them better. This customer data then allows you to build more relevant experiences.
Veronica Saha
Head of Analytics @ Zoopla
2. Repeat purchase rate (RPR)
Repeat purchase rate (RPR), also known as repeat customer rate (RCR), is the percentage of existing customers who make an additional purchase during a specific period.
How to calculate repeat purchase rate: choose a timeframe, and divide the number of customers who purchased more than once by the total number of customers, then multiply by 100:
Repeat purchase rate = (Number of customers who made more than one purchase / Total number of customers) x 100
If you’re using an ecommerce platform like Shopify, you can usually view repeat customer rates in your sales dashboard.
![[Visual] Repeat customer rate shopify 92.86](https://images.ctfassets.net/gwbpo1m641r7/79mXplzUBCqjj9q0tVkXZV/a0f9bf0f074db85703398e3e79e36022/image4__7_.png?w=828&q=100&fit=fill&fm=avif)
The repeat customer rate chart in Shopify
What is a good repeat purchase rate?
According to customer data collected by ecommerce analytics platform Metrilo, the average repeat purchase rate across industries is 28.2%. Expect lower repeat purchase rates in industries with a lot of seasonality and higher rates for regular-use items like pet products or health supplements.
If your store, comparatively, gets significantly fewer repeat purchases, you need to uncover why to get things on the right track. Try adding a sitewide feedback widget with Contentsquare’s Voice of Customer tool to capture customers’ thoughts wherever they want to share them.
Contentsquare’s feedback button lets users provide in-the-moment feedback while on your site
Remember: increasing repeat purchase rate increases the revenue you generate from every new customer you attract, too.
3. Customer churn rate
Customer churn rate, also known as user churn rate, is the percentage of customers who leave during a certain time period (usually one month or one year). Churn is typically used by SaaS and subscription businesses that have monthly or annual contracts with customers.
How to calculate customer churn rate: specify a timeframe and divide the number of customers who left during the period by the total number of customers at the start, then multiply by 100:
Customer churn rate = (Number of customers who left / Total number of customers at start of period) x 100
For example, if you had 1,000 customers on Jan. 1, but 500 left before Dec. 31, your annual user churn rate is:
(500/1000) x 100 = 50%
What is a good customer churn rate?
For SaaS companies, a monthly customer churn rate of between 3% and 8% is considered good. For reference, Buffer has a monthly customer churn rate of around 5%.
![[Visual] Customer metrics buffer chart churn rate](https://images.ctfassets.net/gwbpo1m641r7/77g74o4YKPHPjwIaju5TsB/11674c3bb35d91d1cfe999d180b1550a/image3__14_.png?w=3840&q=100&fit=fill&fm=avif)
Buffer’s monthly customer churn rate
💡Pro tip: reduce churn by learning why customers leave.
The team at Hussle, a gym pass platform, sent a survey to users who canceled their subscriptions, simply asking: “why did you decide to cancel?”.
Luke Calton, Hussle’s Product Lead, grouped similar responses into themes and found that 26% of churning users were buying memberships from local gyms instead. The team then prioritized a new product feature and allowed users to purchase gym memberships directly through Hussle, leading to a reduction in churn and an increase in customer retention.
![[Visual] survey question hussle](https://images.ctfassets.net/gwbpo1m641r7/1ny5gtEkLozCphmetcWMWK/afbbb6c9d56cd5041c251ce1f713df83/image1__16_.png?w=1920&q=100&fit=fill&fm=avif)
The survey question that increased customer retention for Hussle
Get insights needed to improve customer retention
More happy customers means more long-term success for your business. Use Contentsquare to learn why customers churn—and how to keep them coming back.
4. Customer lifetime value (LTV)
Customer lifetime value (LTV or CLTV) is an estimate of the total value of a customer during their relationship with a company.
How to calculate customer lifetime value: for ecommerce, multiply the average order value by the average number of purchases and the average estimated customer lifespan (how long customers typically keep purchasing from you, not how long they might live!):
Customer lifetime value = Average order value x Average number of purchases x Average customer lifespan
For SaaS companies: divide the monthly average revenue per account (ARPA) by your user churn rate (see below). ARPA is monthly recurring revenue (MRR) divided by the total number of customer accounts.
What is a good customer lifetime value?
The higher your LTV, the better. If you’re working to improve retention, you should see LTV increasing over time. In SaaS, LTV is expected to be at least three times more than customer acquisition cost (CAC); i.e. your LTV:CAC ratio should ideally be 3:1 to ensure profitability.
![[Visual] Kit’s LTV over time](https://images.ctfassets.net/gwbpo1m641r7/2bss5uZll4XswllBCt3eQy/9a6075ba9b6e3821138adea86c79b098/image7__9_.png?w=3840&q=100&fit=fill&fm=avif)
Kit’s LTV over time
5. Customer satisfaction score (CSAT)
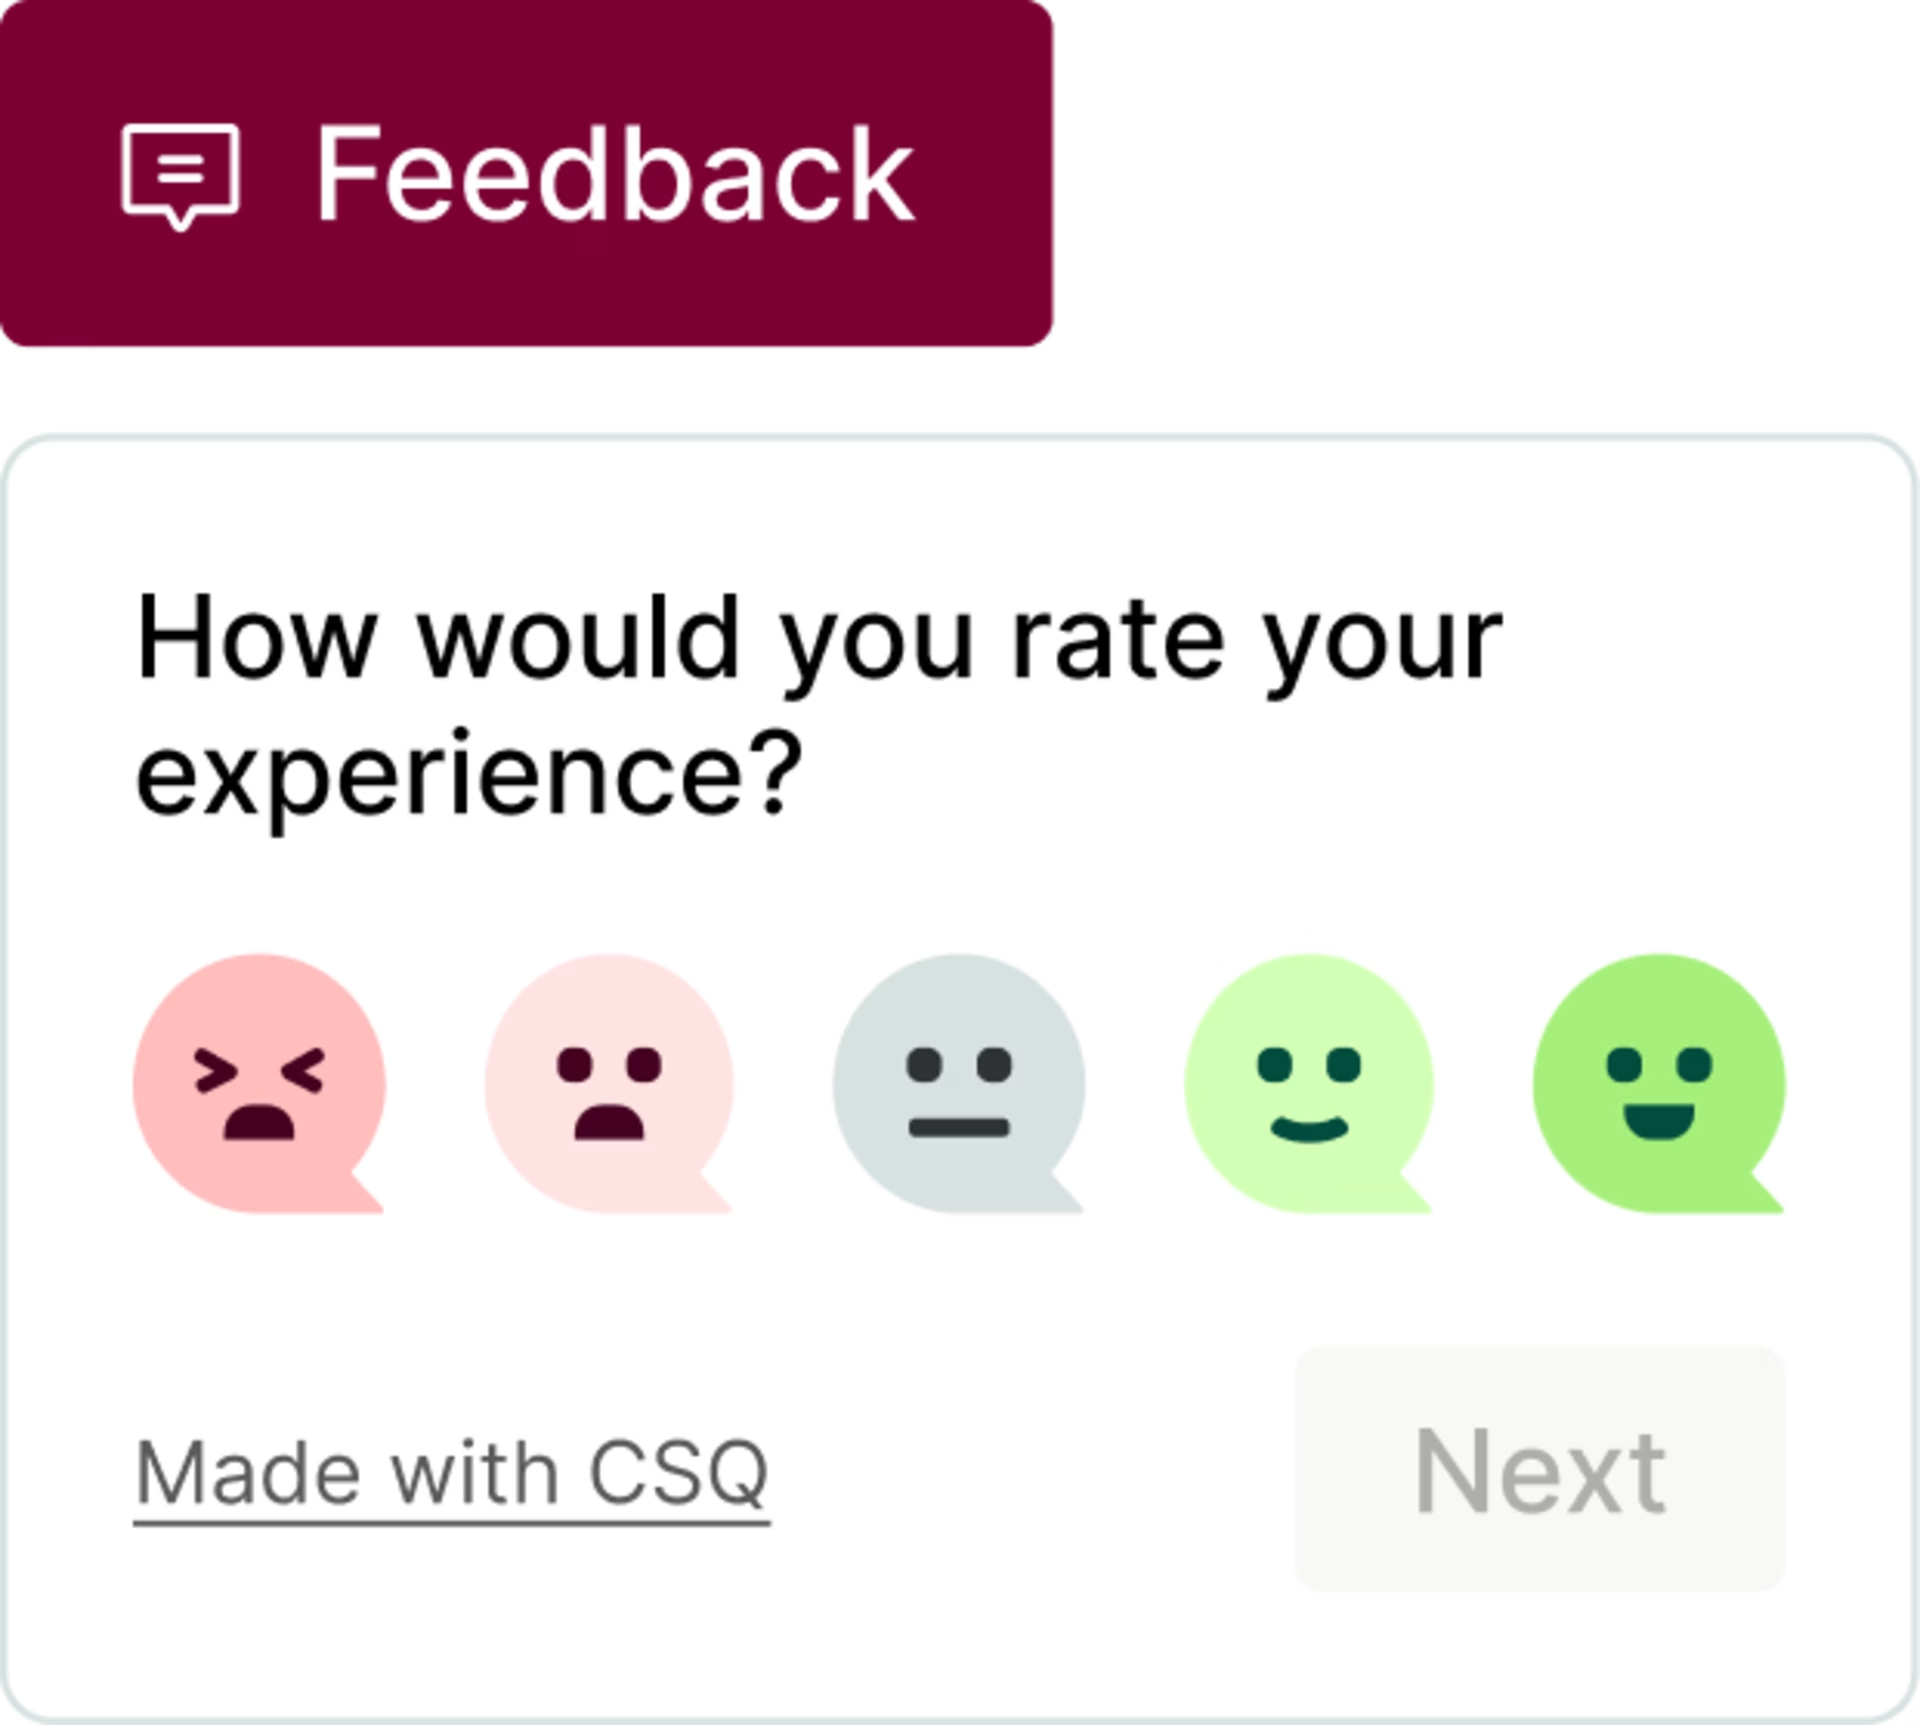
Customer satisfaction score (CSAT) is a measure of how satisfied a customer is with a product or service. CSAT surveys usually contain a simple 5-point scale or binary happy face/sad face option and are sent after a customer has received a product or used a service.
How to calculate customer satisfaction score: add up all the positive responses you receive (those with ‘satisfied’ or ‘very satisfied’ selected), divide by the number of survey respondents, and multiply by 100:
Customer satisfaction score = (Total positive scores / Number of respondents) x 100
What is a good customer satisfaction score?
If you ask a yes/no CSAT survey question, scores can reach 90% and above, and lower scores may mean you have urgent issues to fix (that’s why you always need to ask follow-up questions!).
A 5-point survey will generate lower scores as you’ll also capture neutral responses. Survey your customers to create your own benchmark, and you’ll be able to track if satisfaction is increasing or decreasing over time and measure the impact of your optimizations.
6. Net Promoter Score® (NPS)
Net Promoter Score (NPS) is a numerical measurement of customer loyalty, satisfaction, and enthusiasm based on responses to the question: “On a scale from 0 to 10, how likely are you to recommend this product/company to a friend or colleague?”.